
As they say, there are three kinds of lies; lies, damned lies, and statistics. Well, though this remark seems to be pretty fair, fortunately it has exceptions. For example, Intis Telecom analysis tools that provide its users with detailed and overall statistics on the effectiveness of SMS campaigns and it’s worth-trusting. To make better sense of these data and use it more effectively, try reading our article on how to analyze the results of your campaigns using our texting app tools:
1. Let’s start with the detailed statistics of all text messages sent from an account.
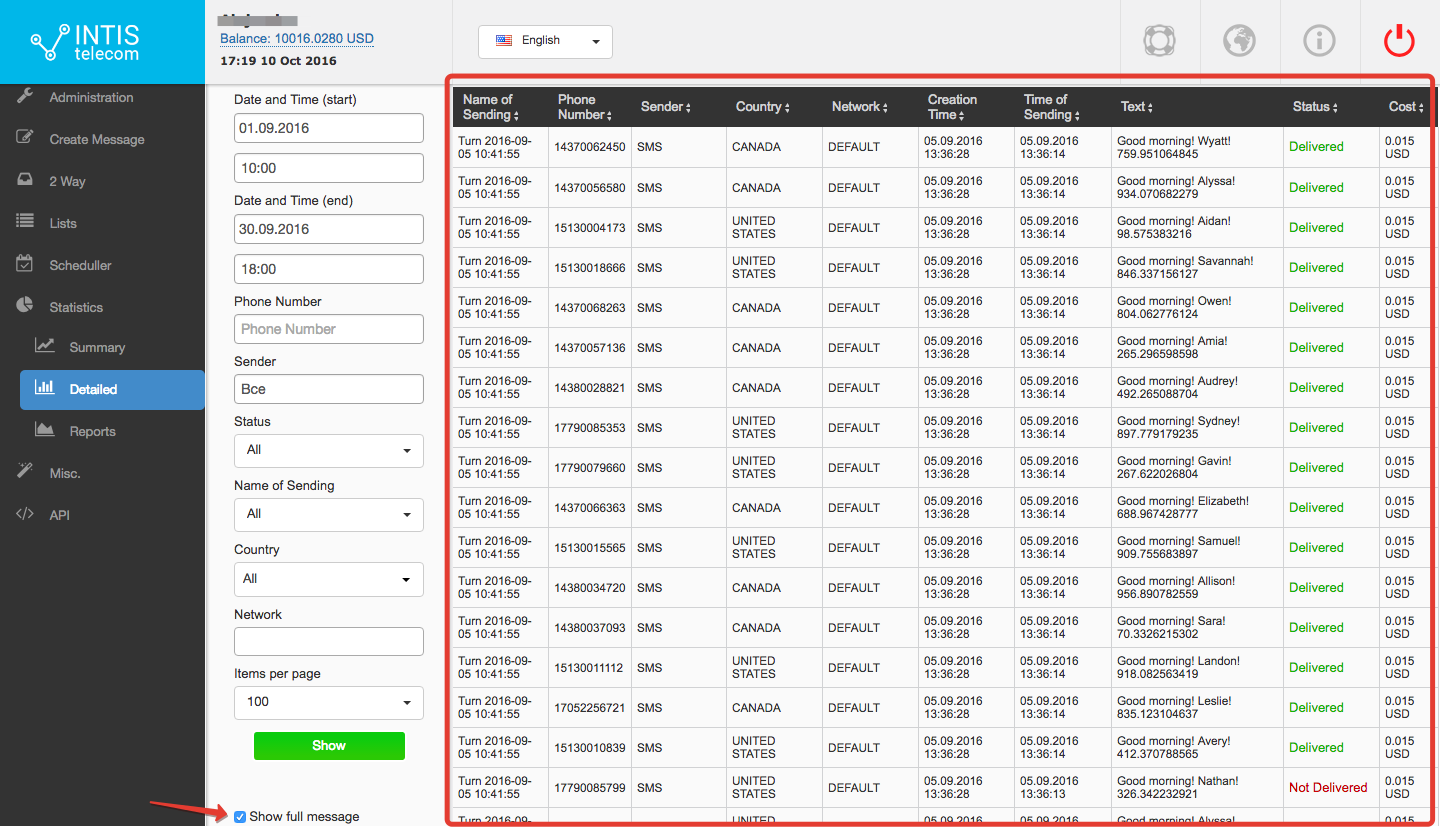
You can find this information in the ‘Detailed’ section of the top menu. This section has filters that help you to get the results on the text messages of a particular campaign.
So, first of all, you have to set the time period you’re interested in.
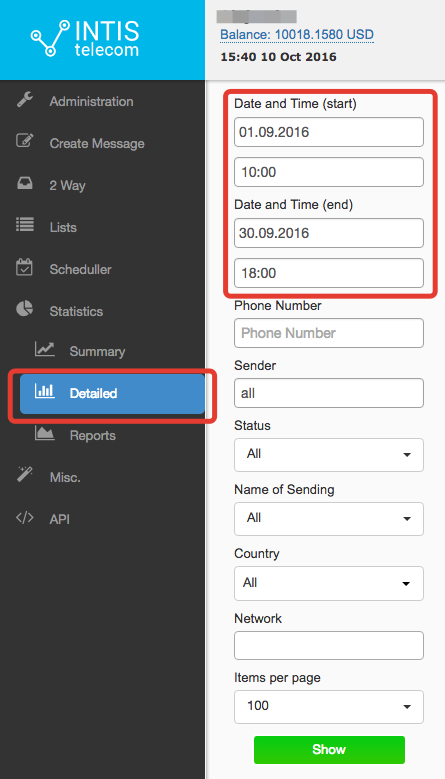
After that, you can fill in the ‘phone number’ parameter if you need to get statistics on message delivery to a certain telephone number.
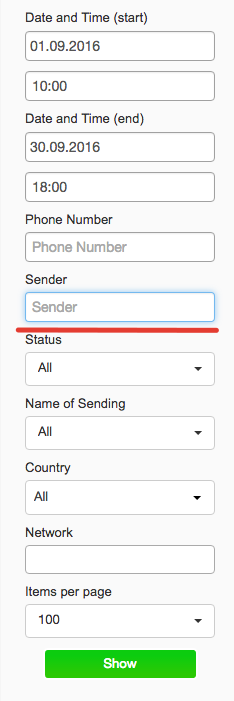
Finally, type the sender names of your mail-outs in the correspondent field or, to see the overall results, simply leave it blank.
Next pick the following options from a drop-down menu:
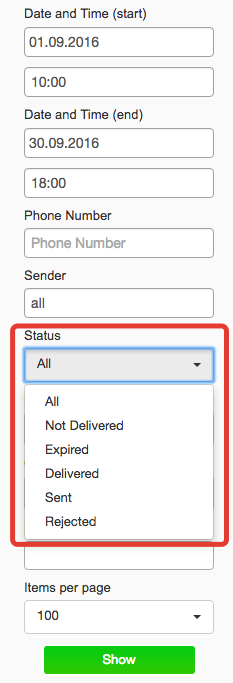
We will explain some of the statuses. An ‘Expired’ status means that there is a certain period of a message lifetime during which our service tries to send out SMS (by default this period is 24 hours, but you can change it in a ‘Create message’ section); and when a message’s lifetime has expired, the SMS won’t be sent any more.
A ‘Rejected’ status arises when there’s something wrong with a recipient’s mobile operator or a telephone number is invalid. It’s better to chat with our managers right from your account page to find out whether it’s possible to fix the problem.
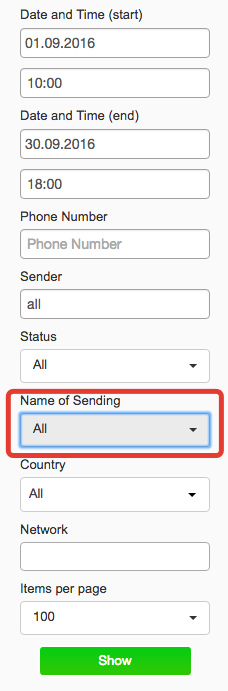
Another parameter to set is the ‘Name of Sending’. It is a good idea to make it a rule to name your sendings to make it easier to differentiate one from another. This parameter helps you to pick out the results of every SMS campaign you’ve held. But if you need to get summary results, pick the option ‘All’:
The next two filters, ‘Country’ and ‘Network’ relate to your recipients. If you need to know how many messages have been sent to a particular country or via a specific mobile operator, then set these parameters as required.
The last parameter is just about displaying the results; choose the number of items you want to be displayed on every page.
Bear in mind that if you tick the box ‘Show full message’, the content of sent messages will be shown in the results too.
So, our sample of detailed statistics looks like this:
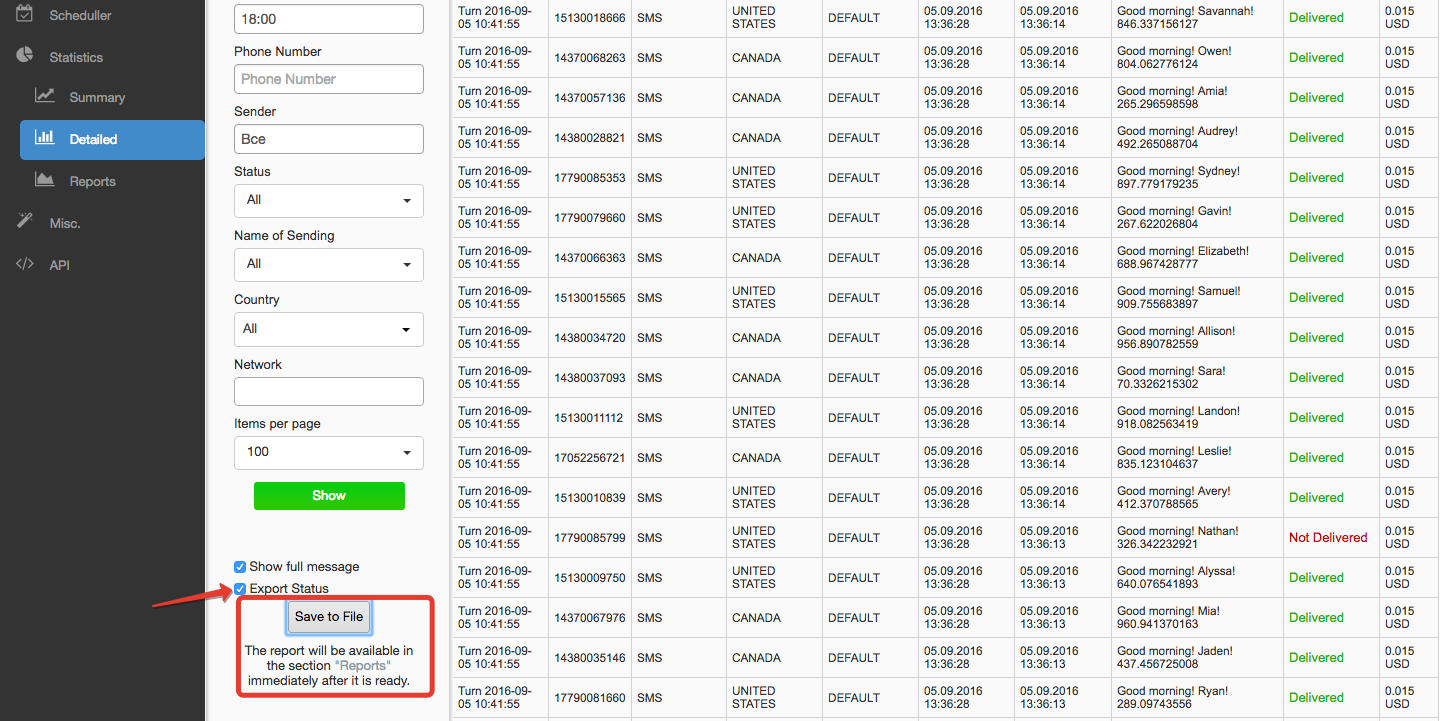
Additionally, you can export the detailed statistics as a CSV or Excel spreadsheet and open it on your computer. To do this you only have to tick the box ‘Export Status’ and click on the ‘Save to File’ button.
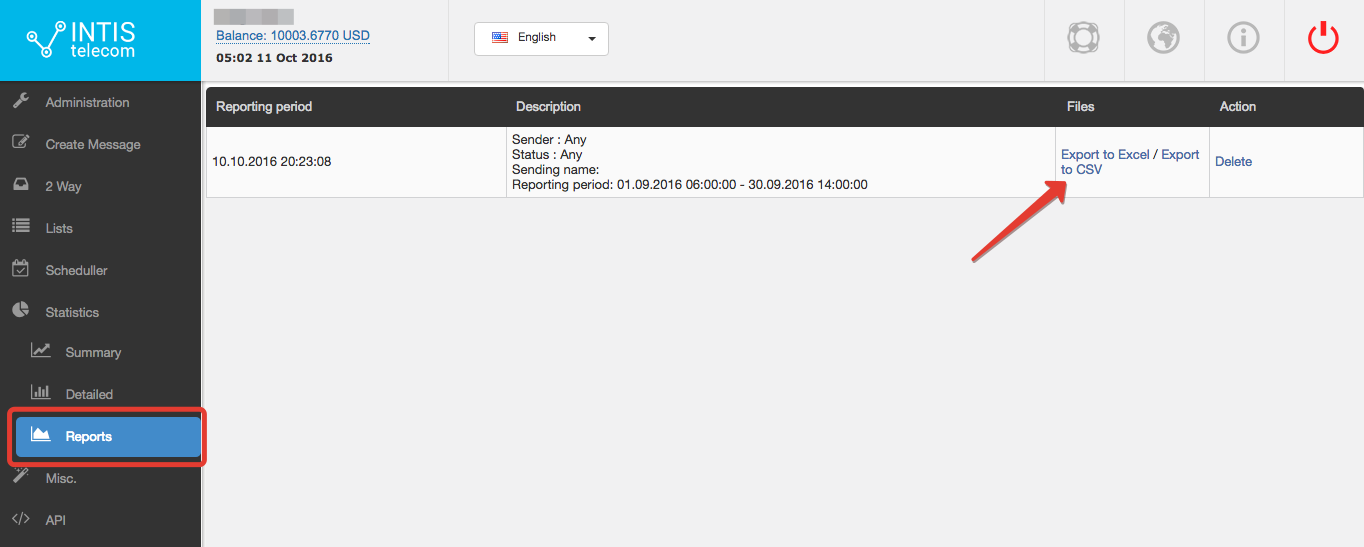
The file itself will appear in a section ‘Reports’, a short time later, all the statistical data will have been processed.
2. How can you get overall statistics on all messages sent from your account?
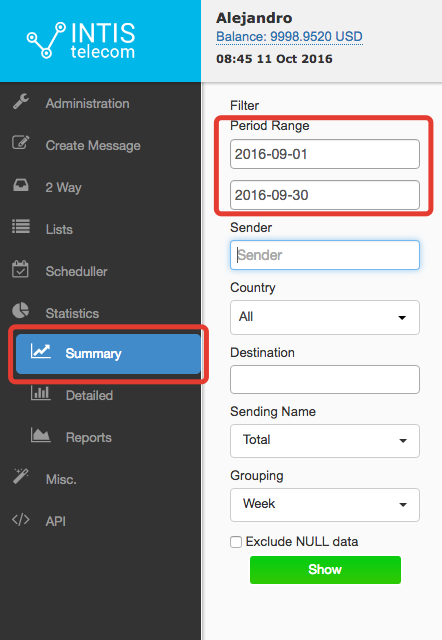
This information is found in the ‘Summary‘ section. It’s different from the detailed spreadsheets as you can see the dynamics and volumes of your campaigns expressed in graphs which are automatically generated using your data.
As usual you may need to play with the filters before you get the chart you want. First, set the time period for your mailouts.
After that, adjust the other parameters. They should be already familiar to you. They are:
- sender name (leave this empty if you have only one or if there are several and you want to get results for all of them);
- country of recipients (set this parameter if you want to have specific results on sendings to a certain country);
- destination (this is actually the same thing as the ‘Network’ filter in the ‘Detailed’ section. It means the mobile operator);
- and the sending name (choose ‘Total’ if you want to get statistics on all the messages from all SMS campaigns).
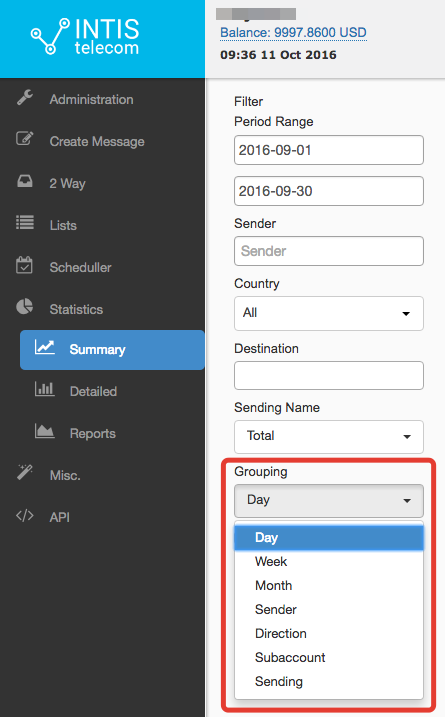
Next, pay attention to the parameters that you haven’t seen before. They are ‘Grouping’ and ‘Exclude NULL data’. The first one is about the way your data will be arranged in the diagram. Information about your mail-outs can be grouped by time (‘day’, ’week’, ’month’), sender name, direction, subaccount and sending name:
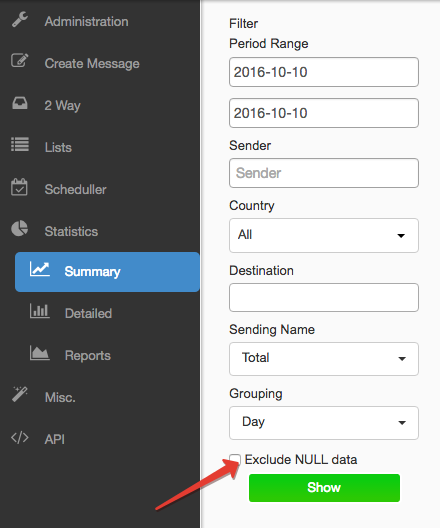
As for ‘Exclude NULL data’, this comes in handy when you set the ranges that include periods when you haven’t sent text messages. To exclude vast amounts of zero data from your charts, you need to tick the box with this filter:
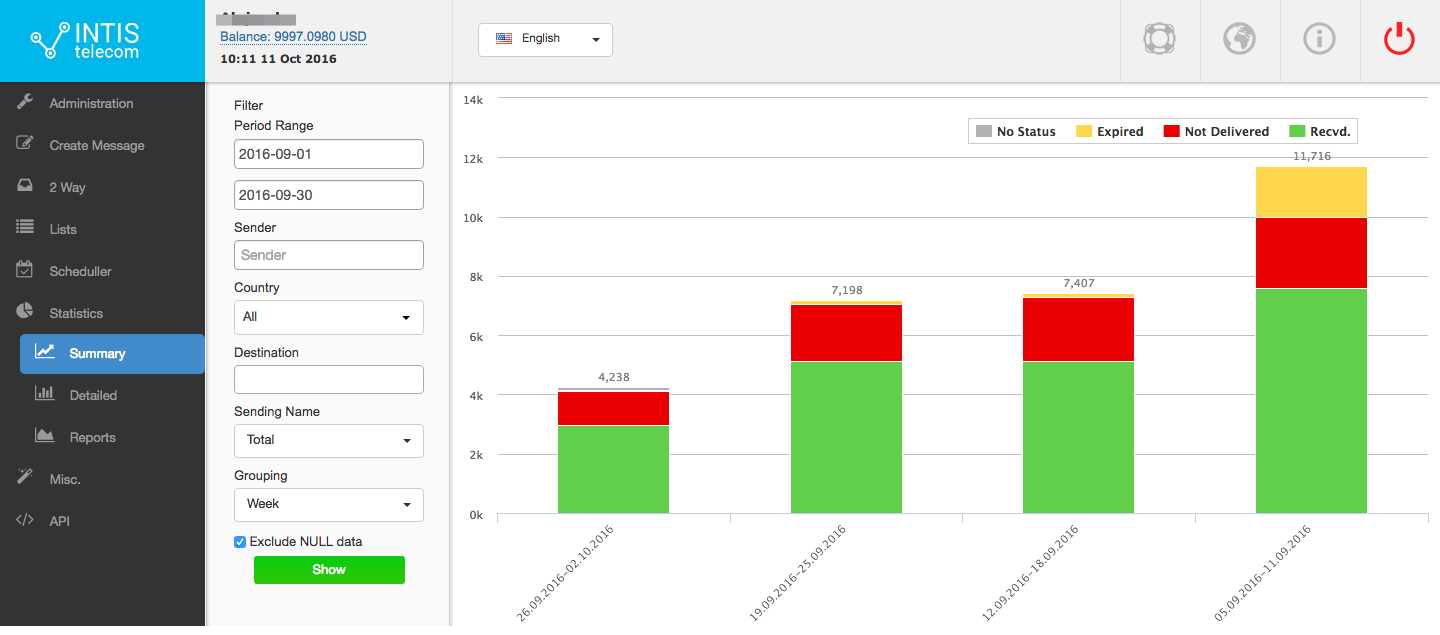
Our sample diagram looks like this:
Have questions about our texting app? Then don’t hesitate to contact us! It’s always our pleasure to help you.

